
Water Pollution and Its Control
Water Pollution and Its Control: Overview
This Topic covers sub-topics such as Water Pollution, Biochemical Oxygen Demand, Eutrophication, Bioremediation, Biomagnification, Thermal Pollution, Algal Bloom, Water Pollution control, Ground Water Pollution and, Oil Pollution
Important Questions on Water Pollution and Its Control
Which of the following is/are the consequences of algal blooms in water bodies
Which of the following impurities are colloidal in nature?
On setting of an industrial unit in an area, the number of bird populations is expected to:
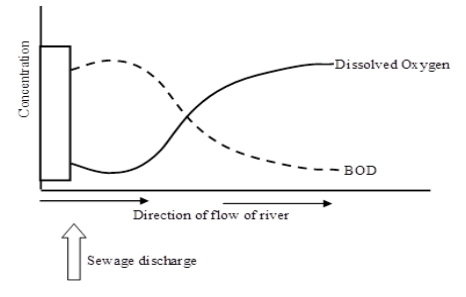
Study the graph given below and choose the option that is correctly describing the relationship between dissolved oxygen (DO) and biochemical oxygen demand (BOD):
A factory drains its waste water into the nearby lake. It has caused algal bloom. The phenomenon responsible for its cause is:
Minamata disease is a pollution related disease. It results from -------------------------.
Drinking mineral water with very low level of pesticides (0.02ppm) for long periods may
Biological Oxygen Demand (BOD) is a measure of
Which of the following is biodegradable pollutant?
Fluoride pollution mainly affects
Which of the following is called the ‘Terror of Bengal’
Read the following statements and select the correct option from below:
I. Genetically modified crops are more susceptible to natural stress conditions like drought, salinity, etc., as compared to normal crops
II. For the treatment of ADA (adenosine deaminase) deficiency treatment, a functional ADA cDNA was introduced to the lymphocytes of the patient by using lambda phage virus
III. There are more than 3,00,000 rice varieties in India alone
IV. Nitrates, phosphates are easily removed from polluted water in the water treatment plant.
Government of India has passed Water (Prevention and Control of Pollution) Act, in
Black foot disease is due to
Prime contaminants leading to cultural or accelerated eutrophication are
Match the column
| Column I | Column II | ||
| a. | Environment (Protection) Act | (i) | |
| b. | Air (Prevention and Control of Pollution) Act | (ii) | |
| c. | Water (Prevention and Control of Pollution) Act | (iii) | |
| d. | Montreal Protocol | (iv) | |
| e. | National Forest Policy | (v) | |
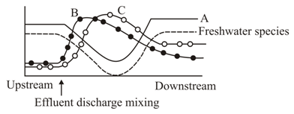
The graph given below shows changes in the different ecological parameters due to mixing of effluent in a stream. The three lines and represent:
In an area DDT had been used extensively. The population of birds declined significantly because


